
3-point makes per game can show which players make the most threes, but it does not tell the whole story. By comparing makes, attempts, and 3-point percentage, users can better understand both volume and efficiency.
The Raw Data
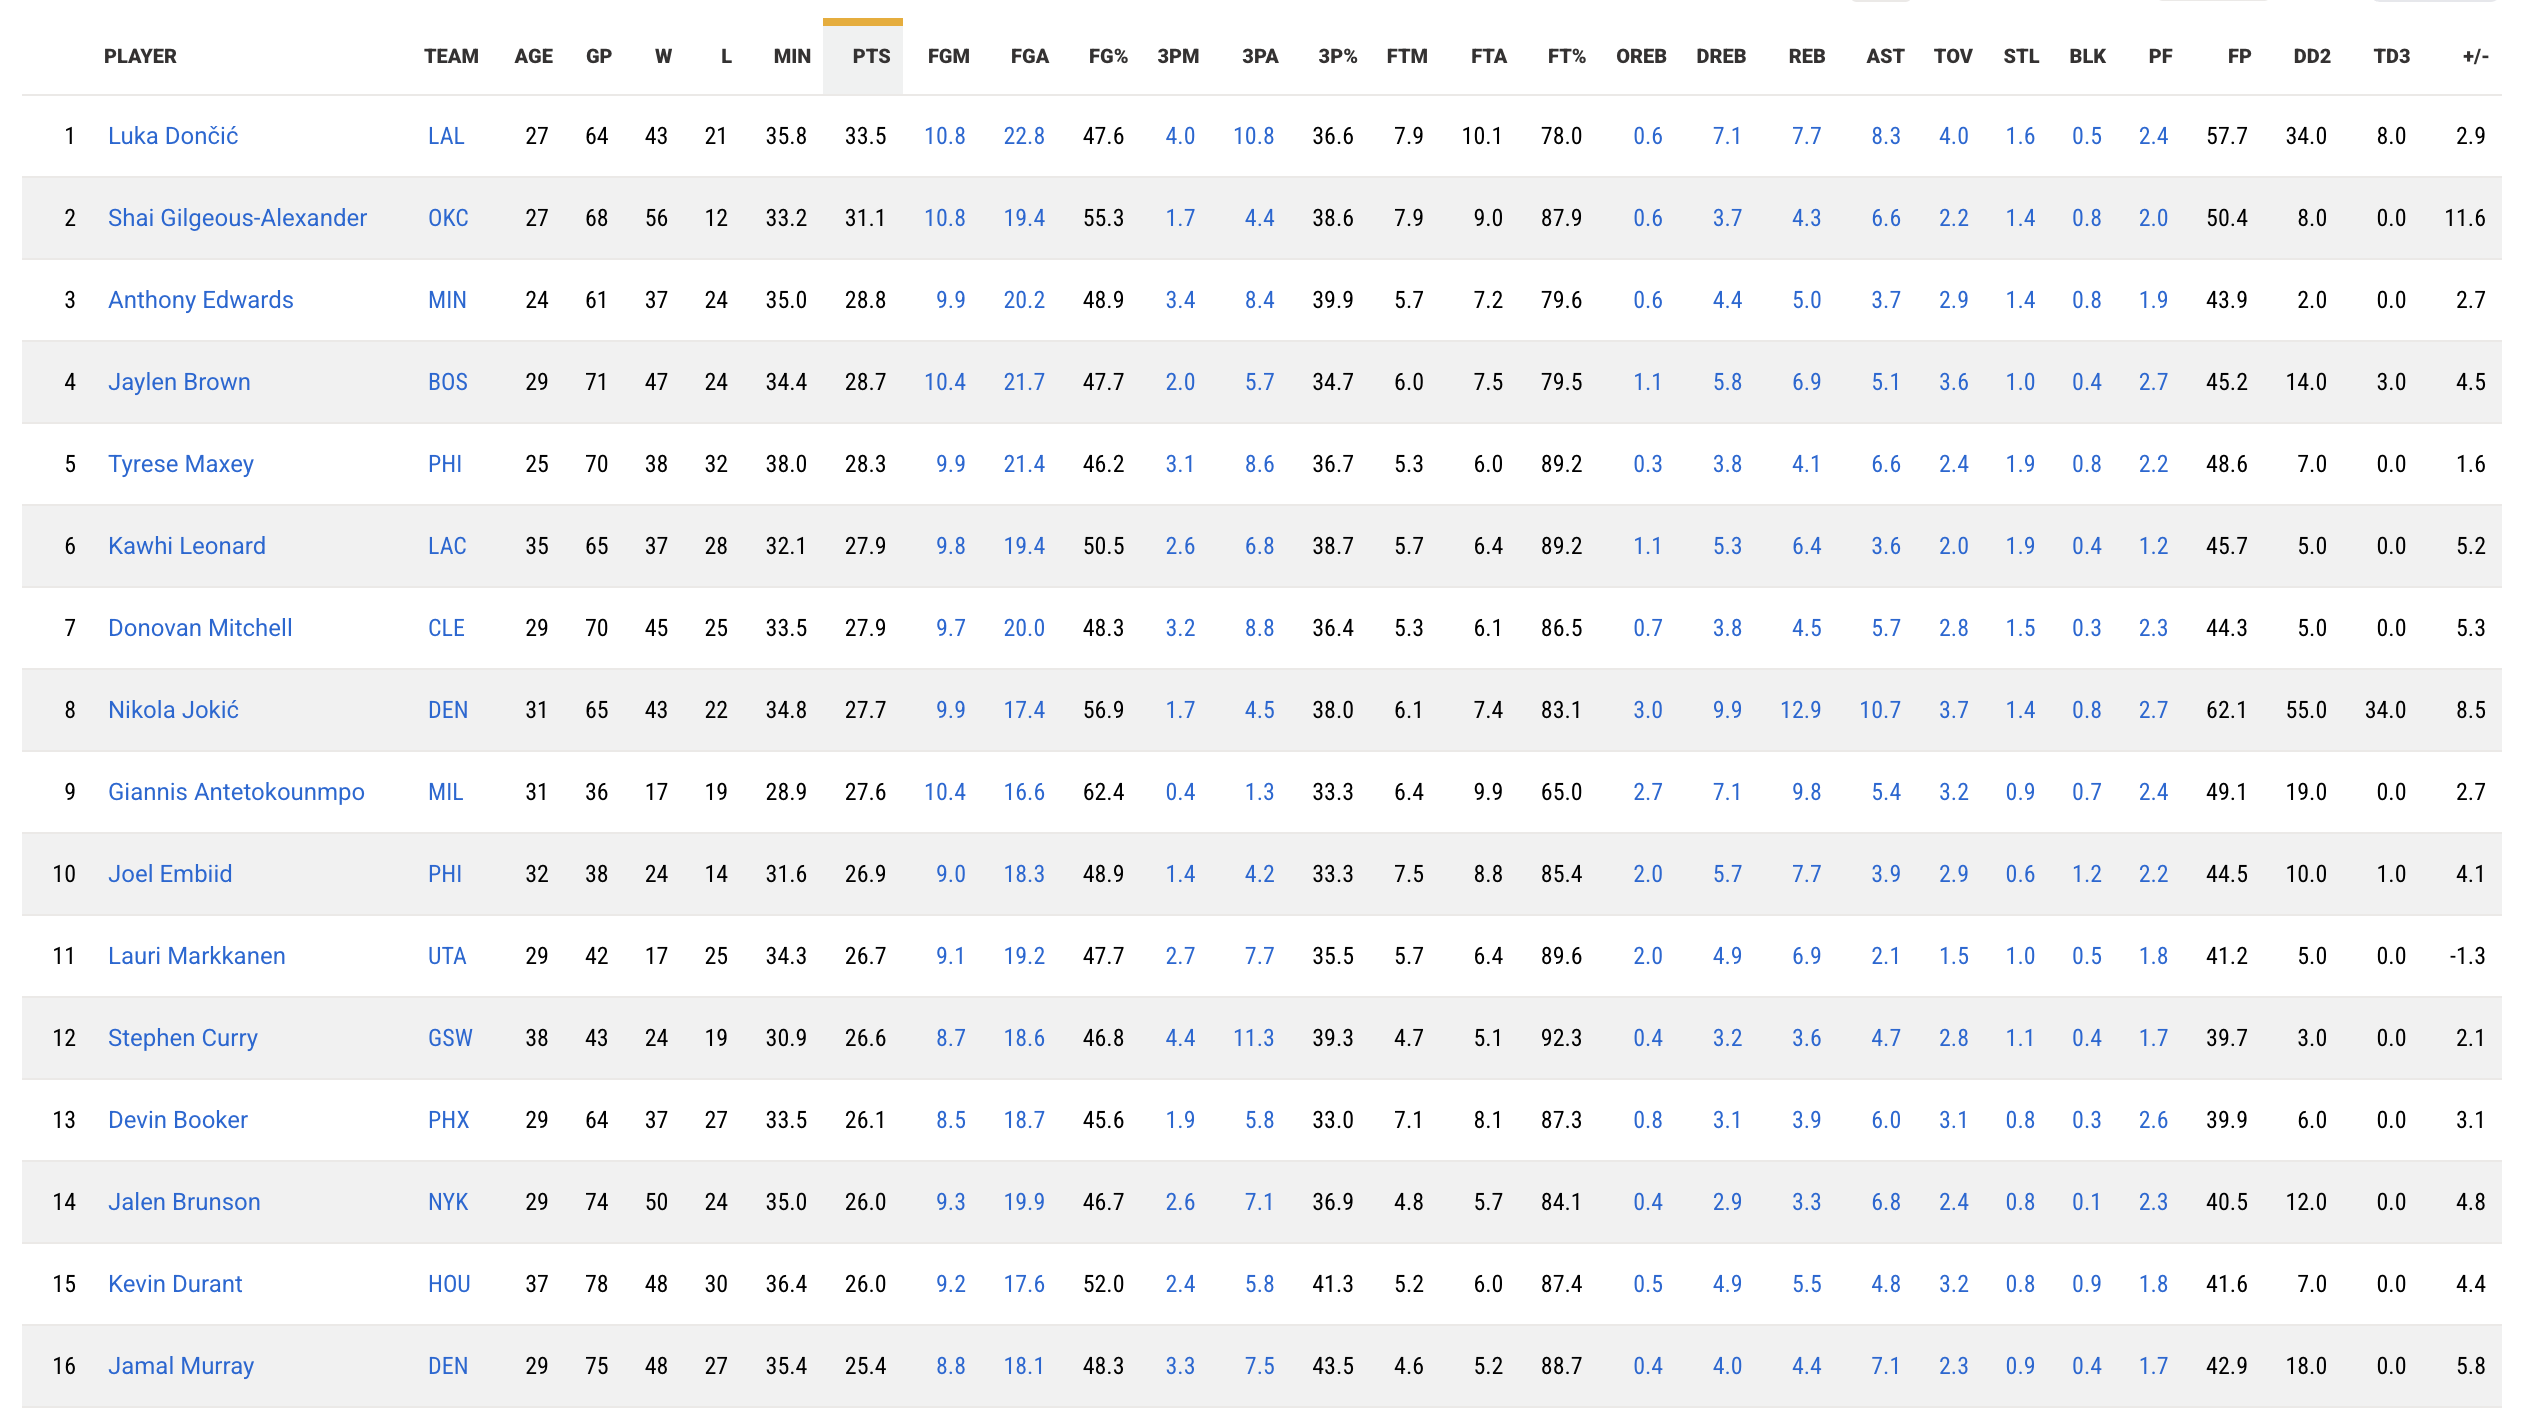
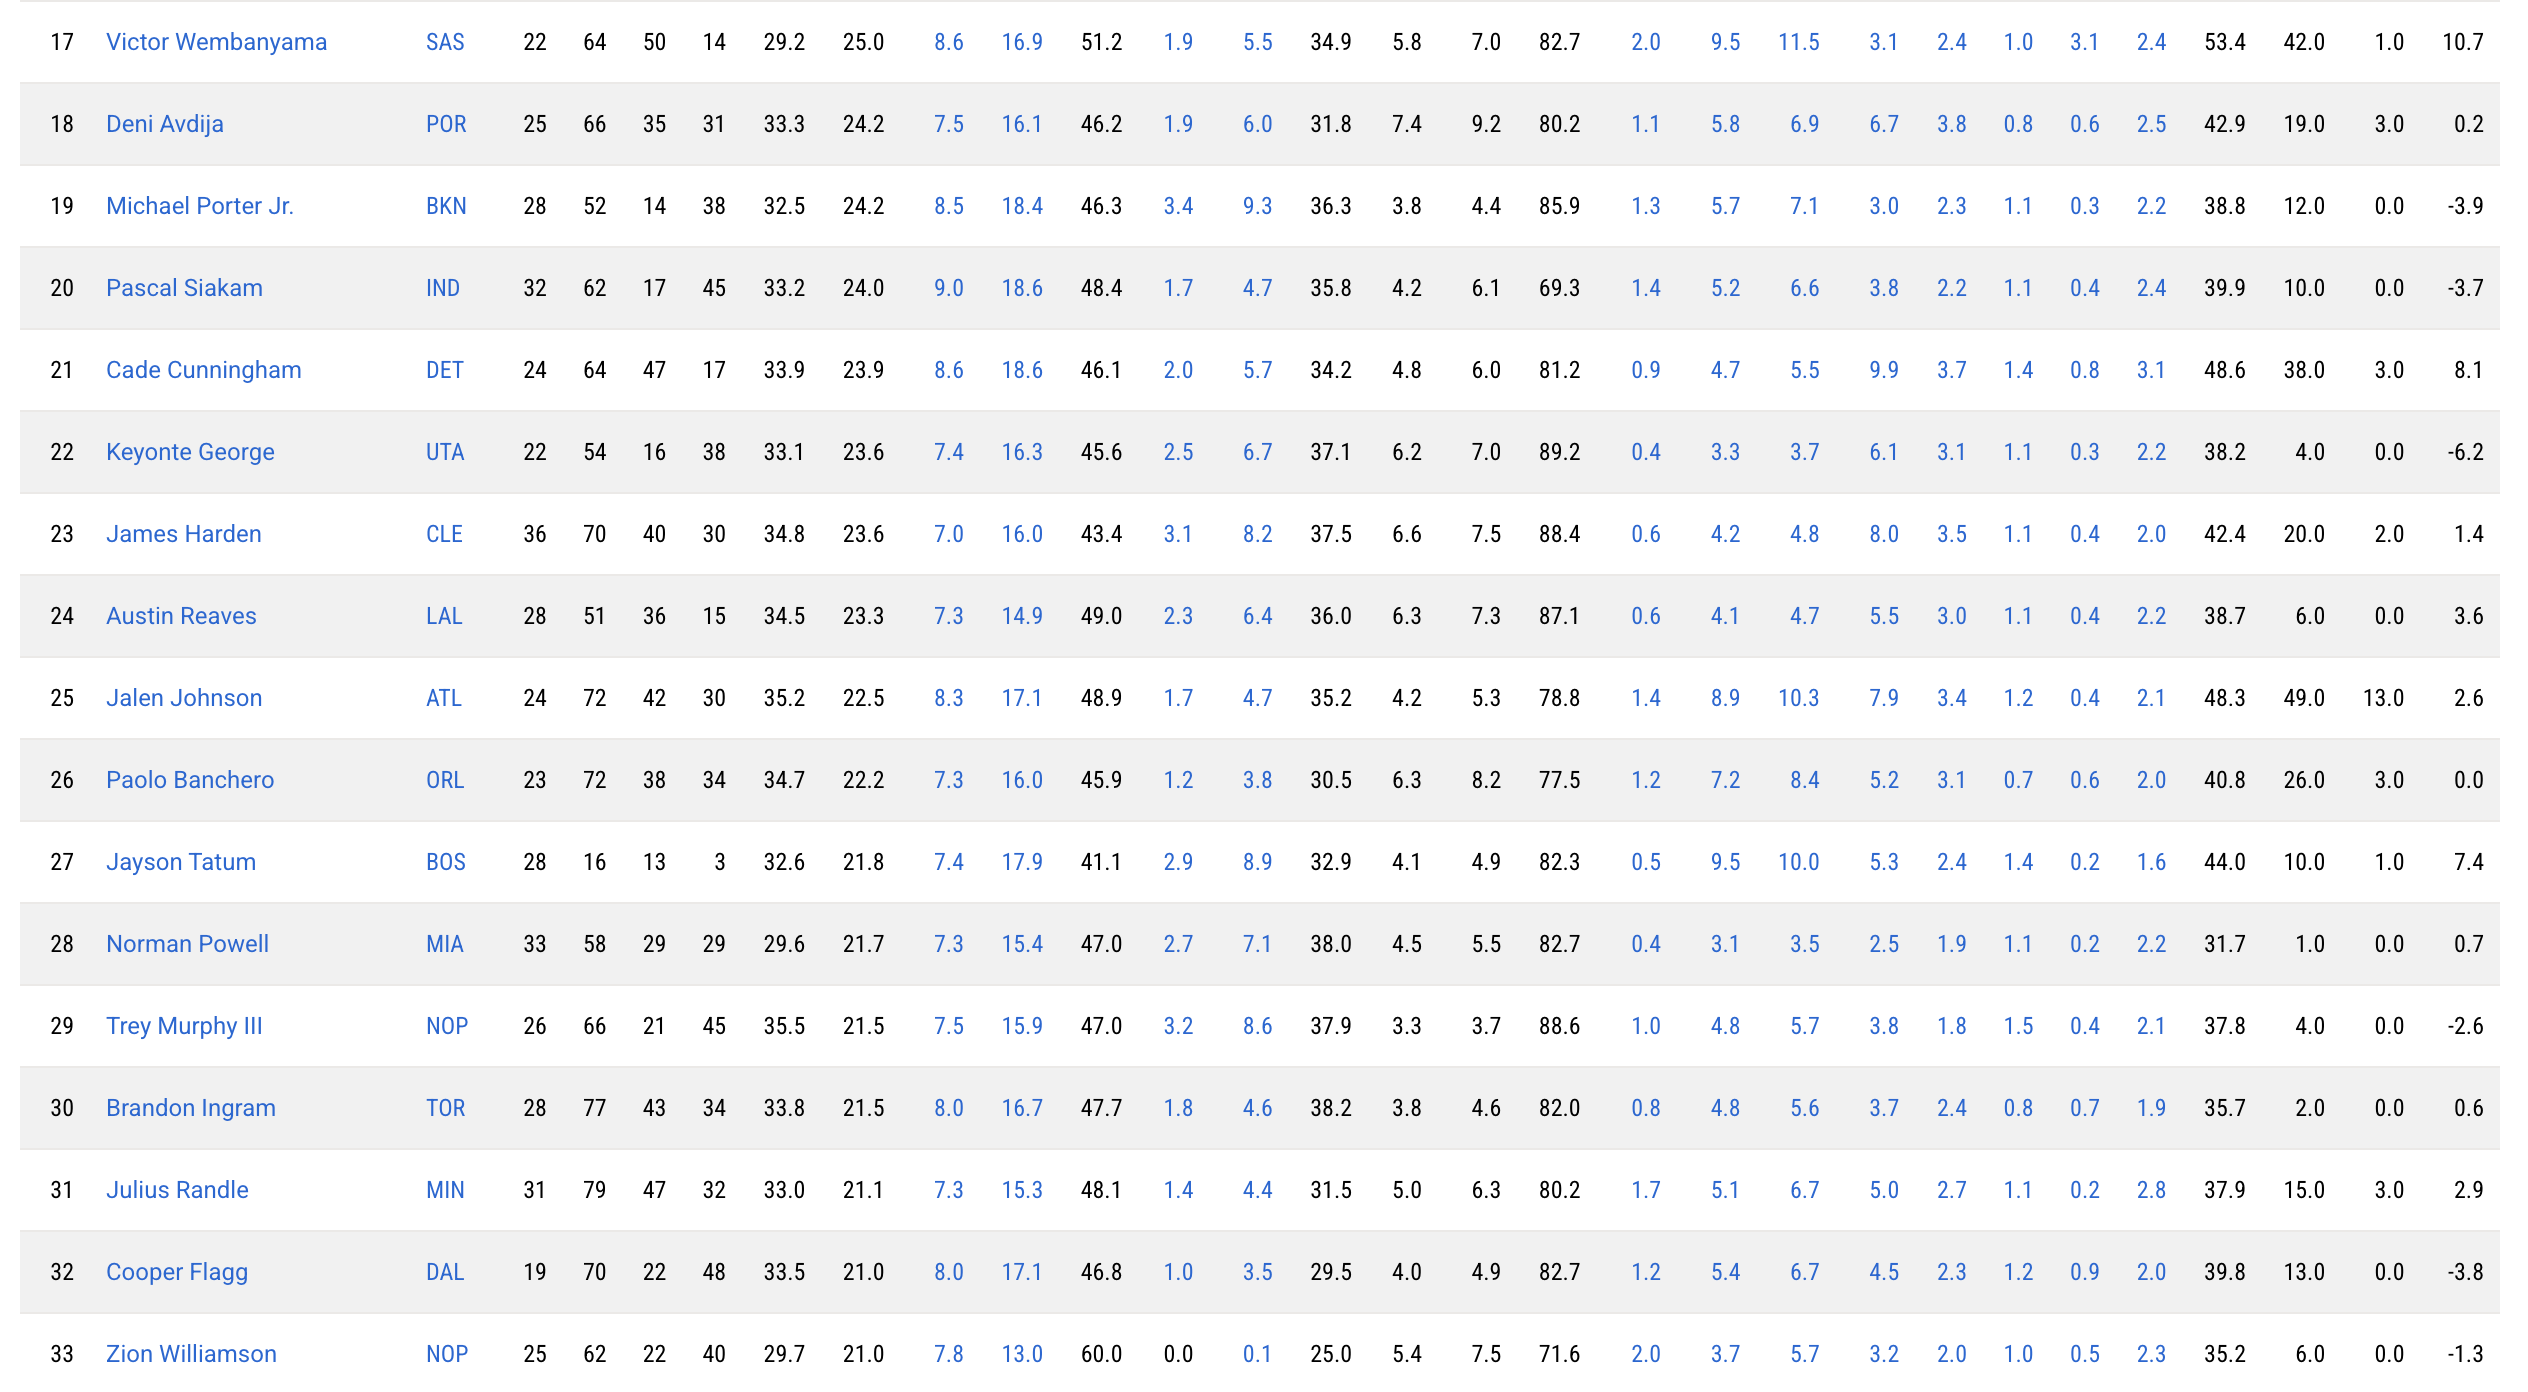
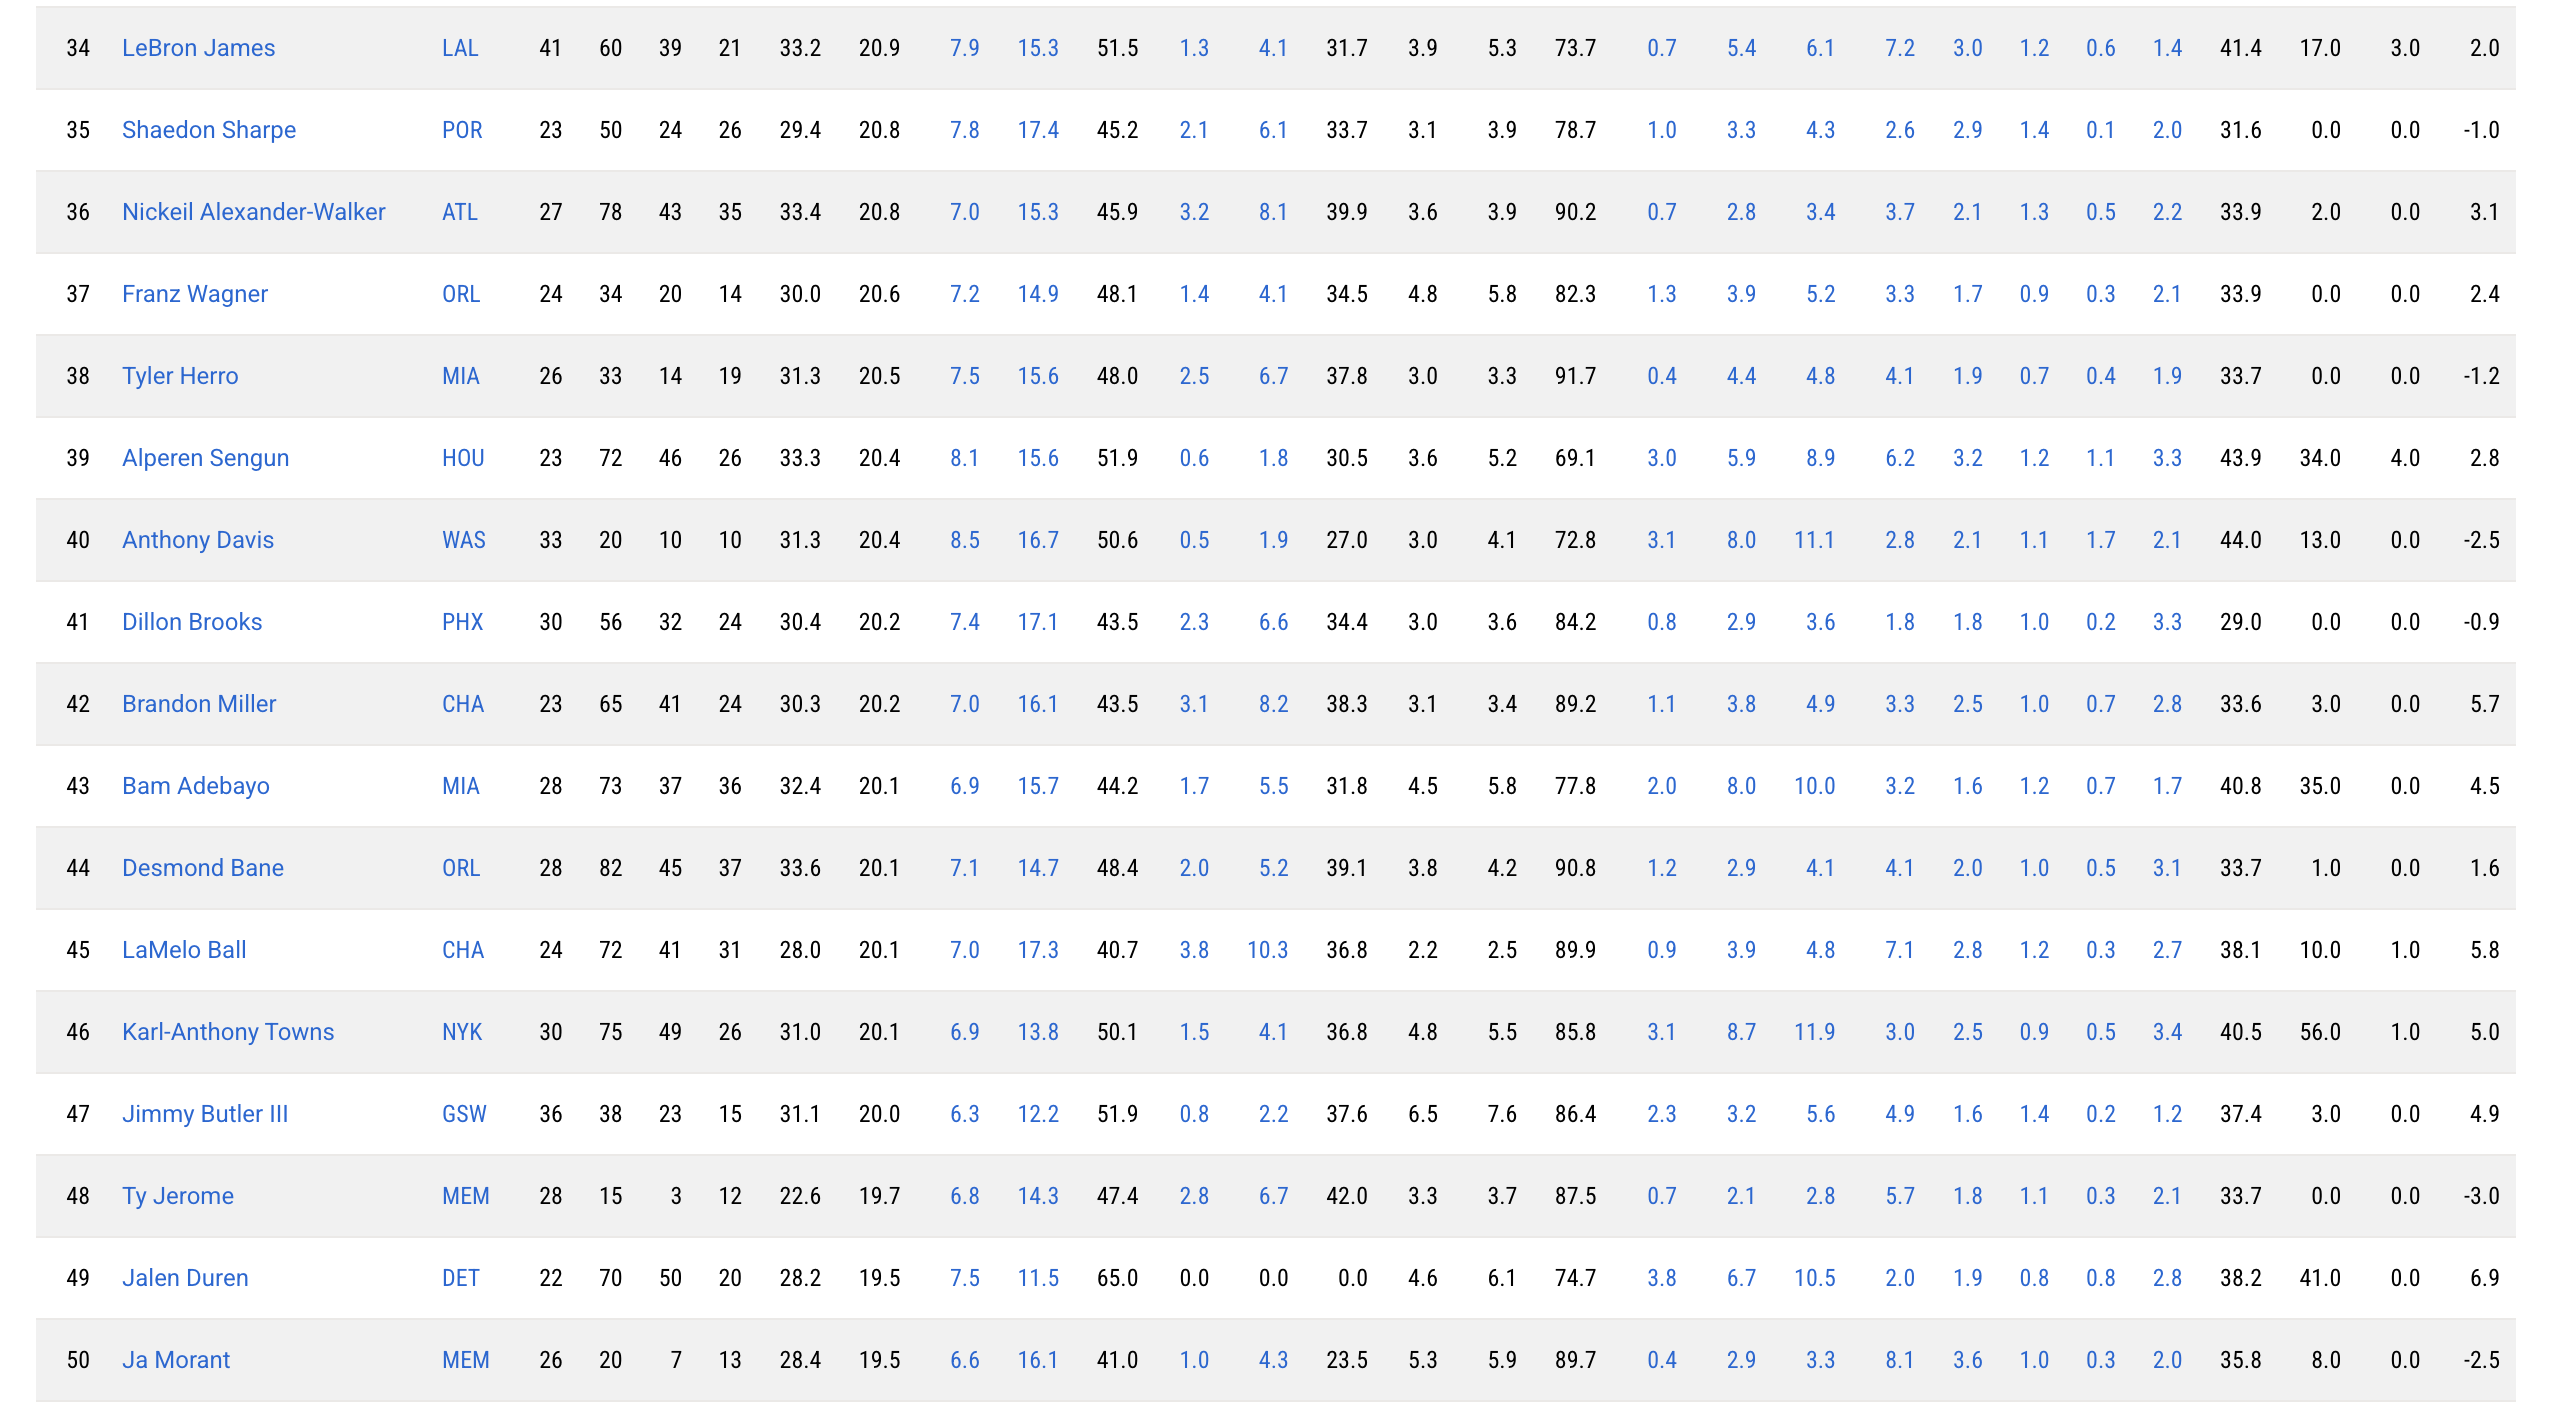
Before drawing conclusions about player performance, it is important to look at the underlying data. The following examples show the raw statistics available for NBA players, including 3-pointers made, 3-point attempts, 3-point percentage, and other player statistics.
Stats are sourced from NBA.com
How Can This Information Be Used?
- Coaches & Teams: Compare players’ shooting volume and efficiency to identify strengths and areas for improvement.
- Fans: Look beyond basic rankings to better understand how efficiently players are shooting.
- Analysts: Use multiple statistics to compare players and identify trends that may not be visible from one statistic alone.
- Bettors: Compare a player’s shooting volume and efficiency to help evaluate their potential performance in a game.
This data can help different users better understand and compare NBA players.
Turning Raw Data into Information
The raw data contains many statistics for each player. For this analysis, the most relevant statistics are 3-pointers made, 3-point attempts, and 3-point percentage. Focusing on these measurements makes it possible to compare both shooting volume and shooting efficiency.
The Problem With a Simple Leaderboard
Why 3-Point Makes Alone Can Be Misleading. First we must look at the ESPN seasons leaders stats below.
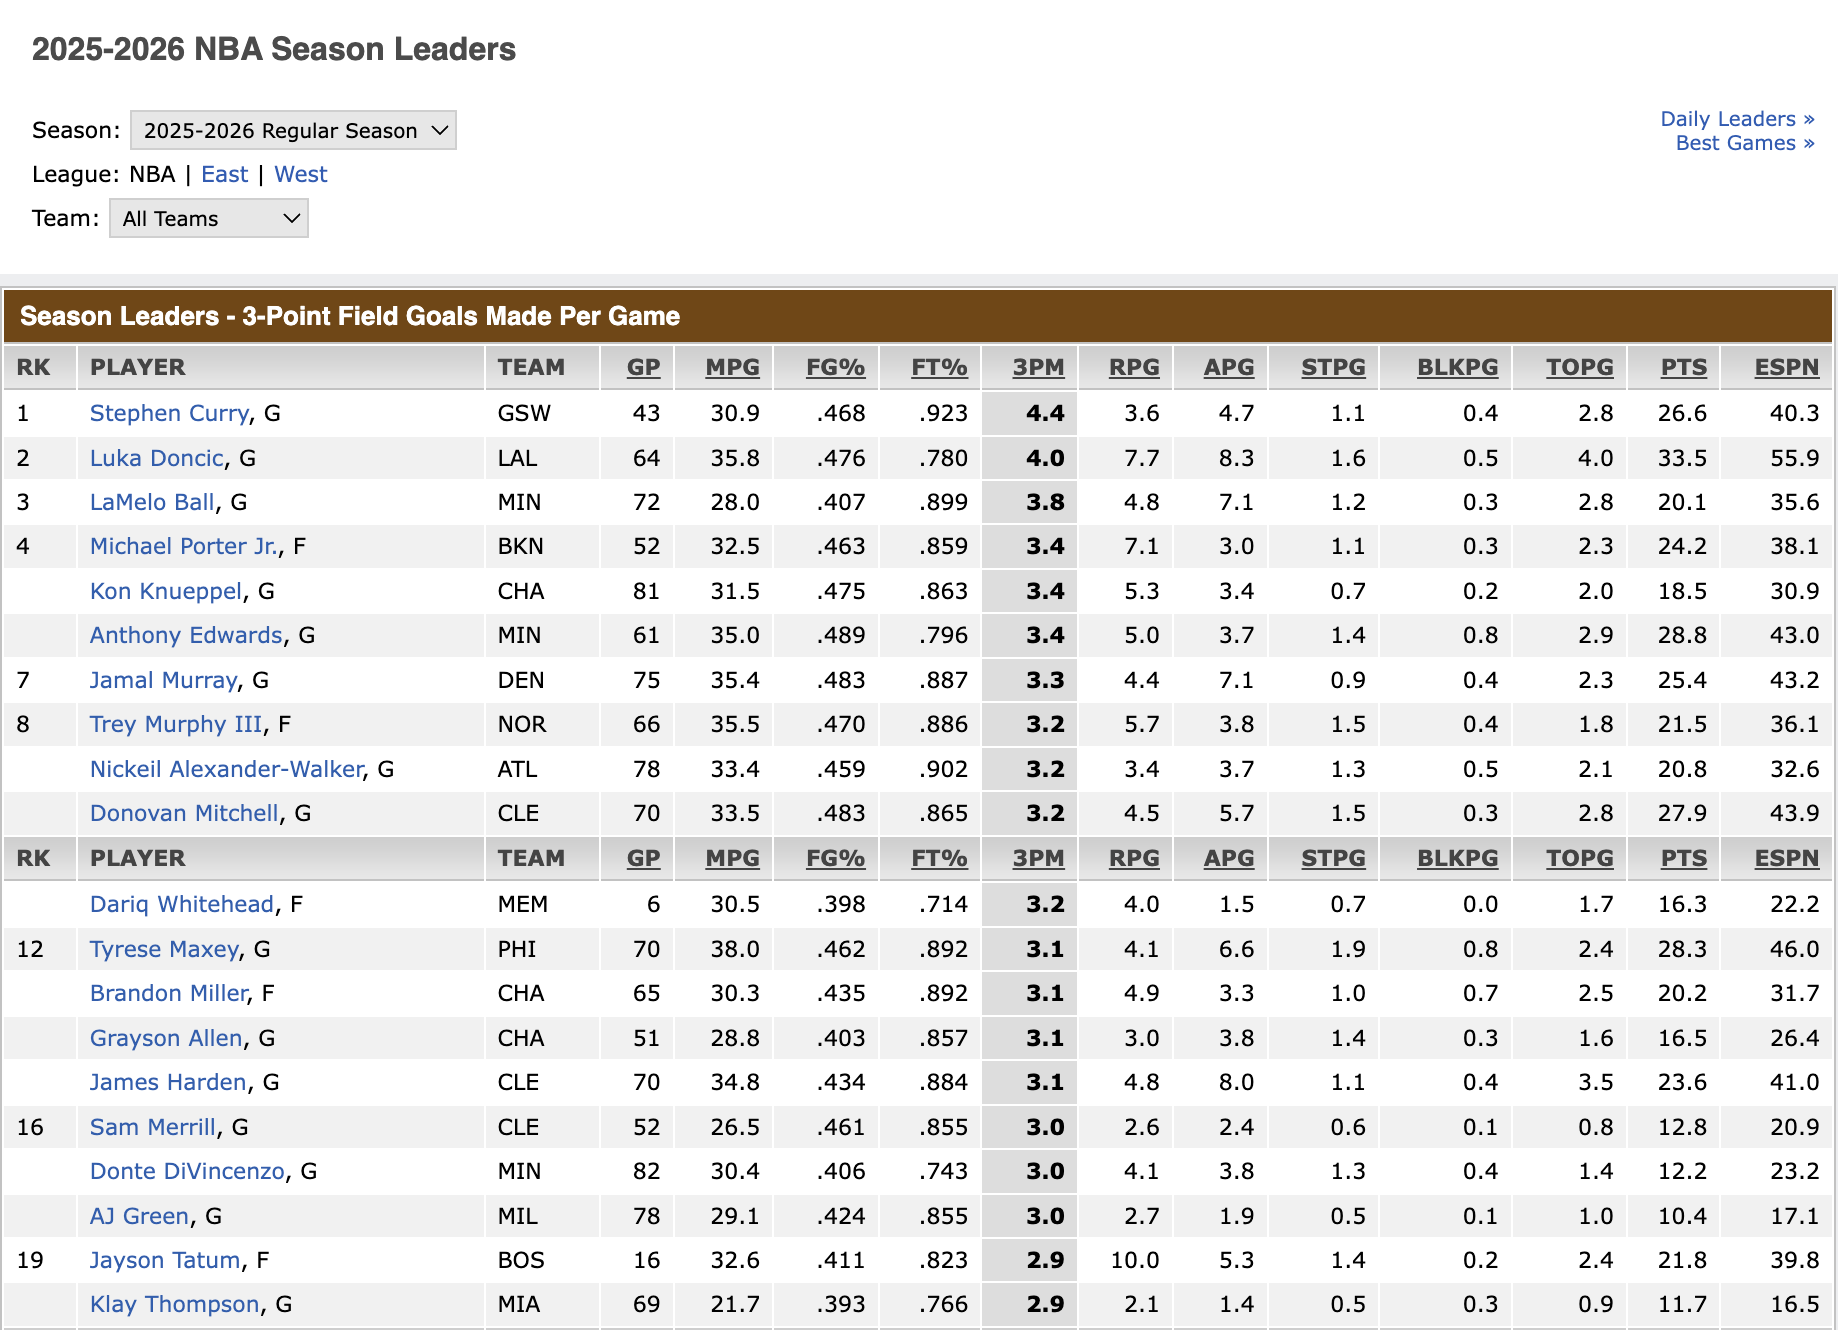
A leaderboard can quickly identify players who make the most three-point shots per game. However, looking only at makes does not show how many attempts a player needs to produce those makes.
Changing the Way We Compare Players
 State Muse source provides these statistics together with other measures of player performance. By comparing multiple statistics instead of relying on one ranking, we can get a more complete picture of a player’s 3-point shooting.
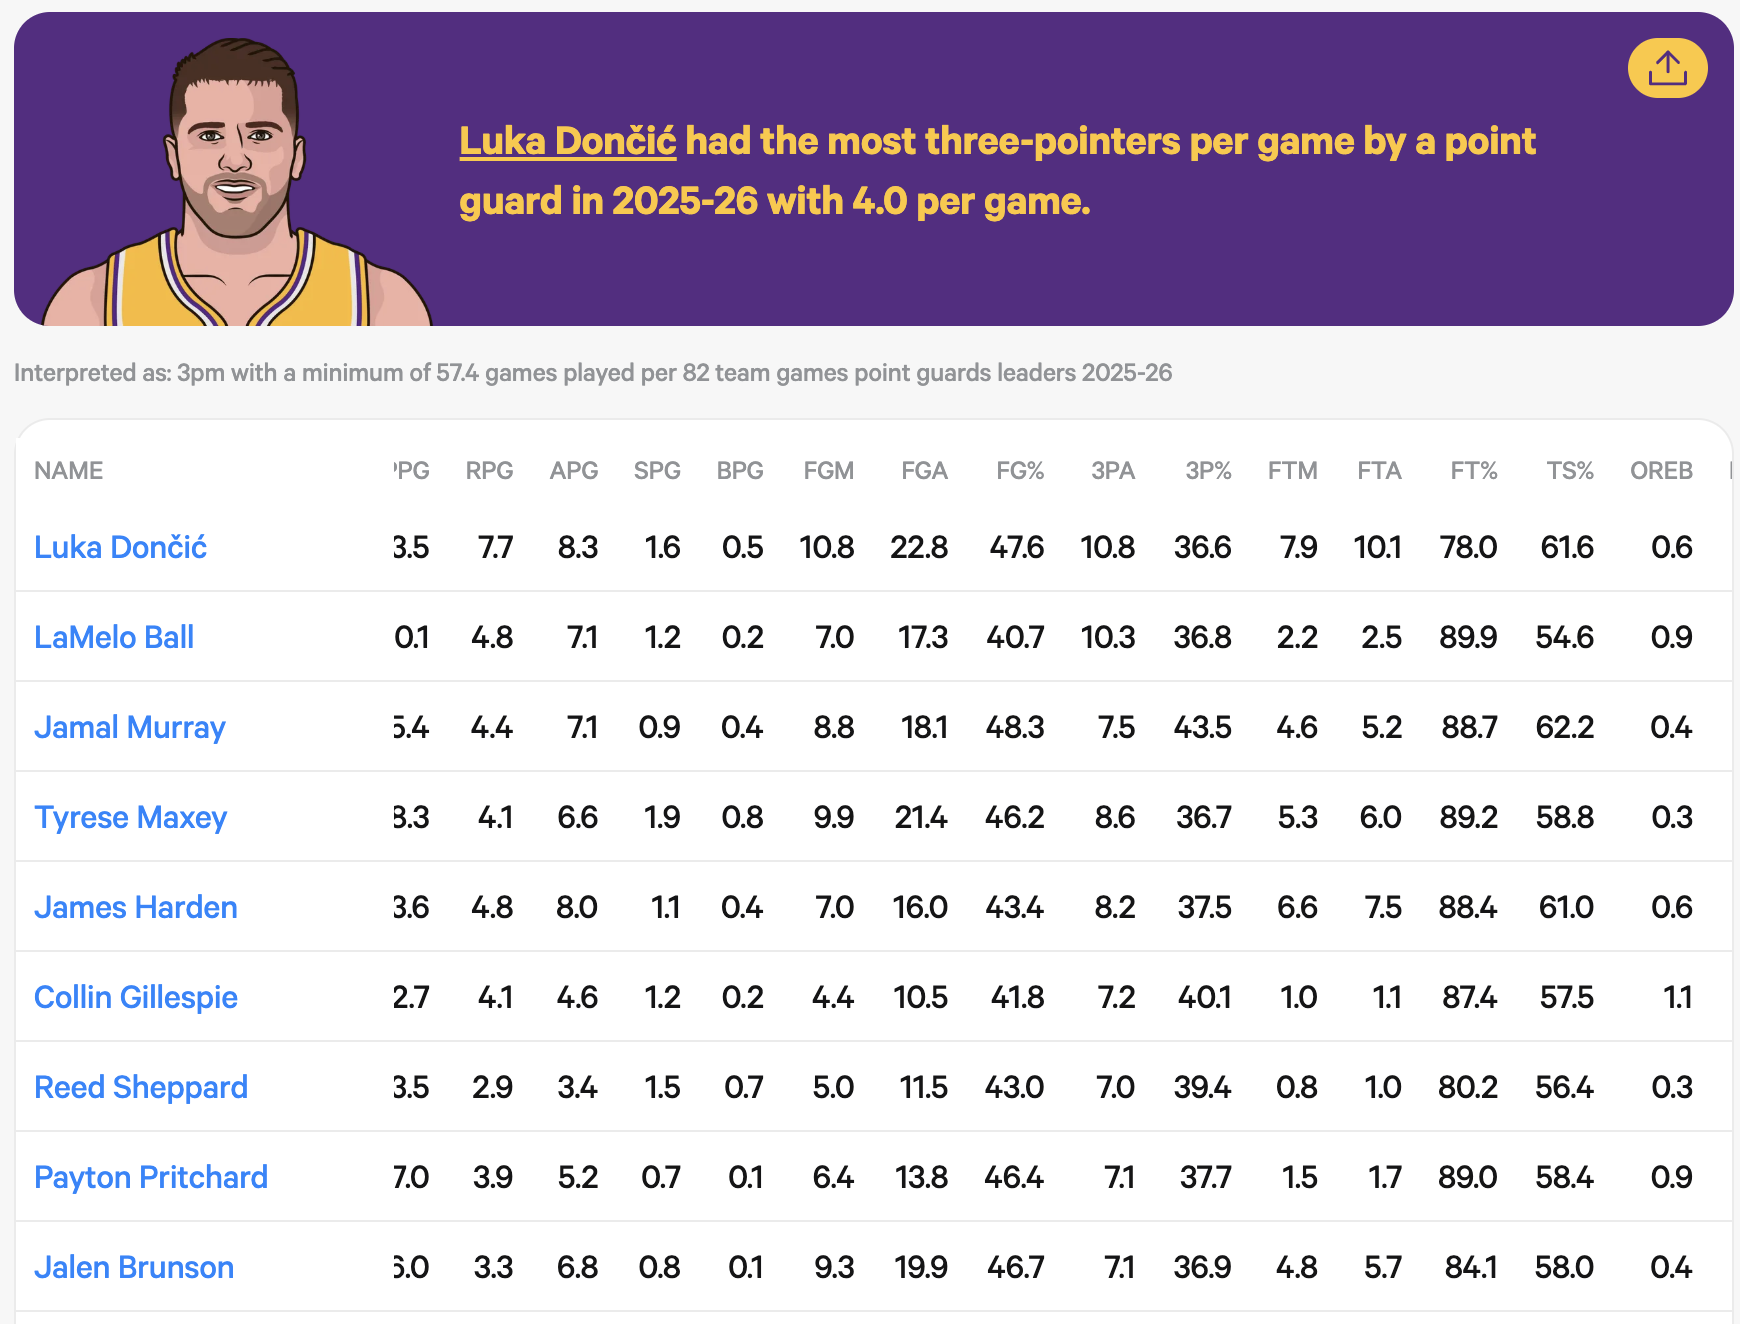
Comparing 4 NBA Guards in the 2025-2026 Season
- Steph Curry: 4.4
- Luka Doncic: 4.0
- LaMelo Ball: 3.8
- Anthony Edwards: 3.4
- Steph Curry: 11.3
- Luka Doncic: 10.8
- LaMelo Ball: 10.3
- Anthony Edwards: 8.4
- Steph Curry: 39.9%
- Luka Doncic: 36.6%
- LaMelo Ball: 36.3%
- Anthony Edwards: 39.9%
Looking beyong the leader board:
Volume: Curry makes the most three-pointers per game among the players being compared.
Attempts: Players who attempt more threes have more opportunities to make them.
Efficiency: Edwards has the same 3P% as Curry despite making fewer threes per game.
In-Depth Analysis
Goal: Compare the 3-point shooting of Curry, Dončić, Ball, and Edwards using multiple statistics.
- Find the Leaders: First, use the leaderboard to identify players who make the most 3-pointers per game.
- Compare Attempts Next, compare 3-point attempts to see how often each player shoots from three.
- Compare Efficiency Finally, compare 3P% to see how efficiently each player shoots.
Looking at all three statistics gives a better understanding of each player’s performance. Curry combines high volume with high efficiency, while Edwards has the same 3P% despite making fewer threes. Dončić makes more threes than Ball, but Ball has a slightly higher 3P%.
Making more three-pointers does not necessarily mean shooting more efficiently.
AI was used to help style the website.